
To get your information across and keep your audience interested, make sure you’re utilising infographics in your blogs, email content and social media strategy. Below are a few benefits of using infographics.
Infographics are a great way to convey stats and information in an easy-to-digest format. Half the public (49%) say they feel like their attention span is shorter than it used to be, likely due to the increasing usage of social media, video content and smartphones. This means as a digital marketing professional, you have less time than ever before to grab your target audience’s attention.
To learn more about attracting new audiences with digital marketing feel free to get in touch with our team after you’ve read this blog by phone at 0161 327 2635 or email info@embryo.com.
6 Ways They Improve Brand Awareness
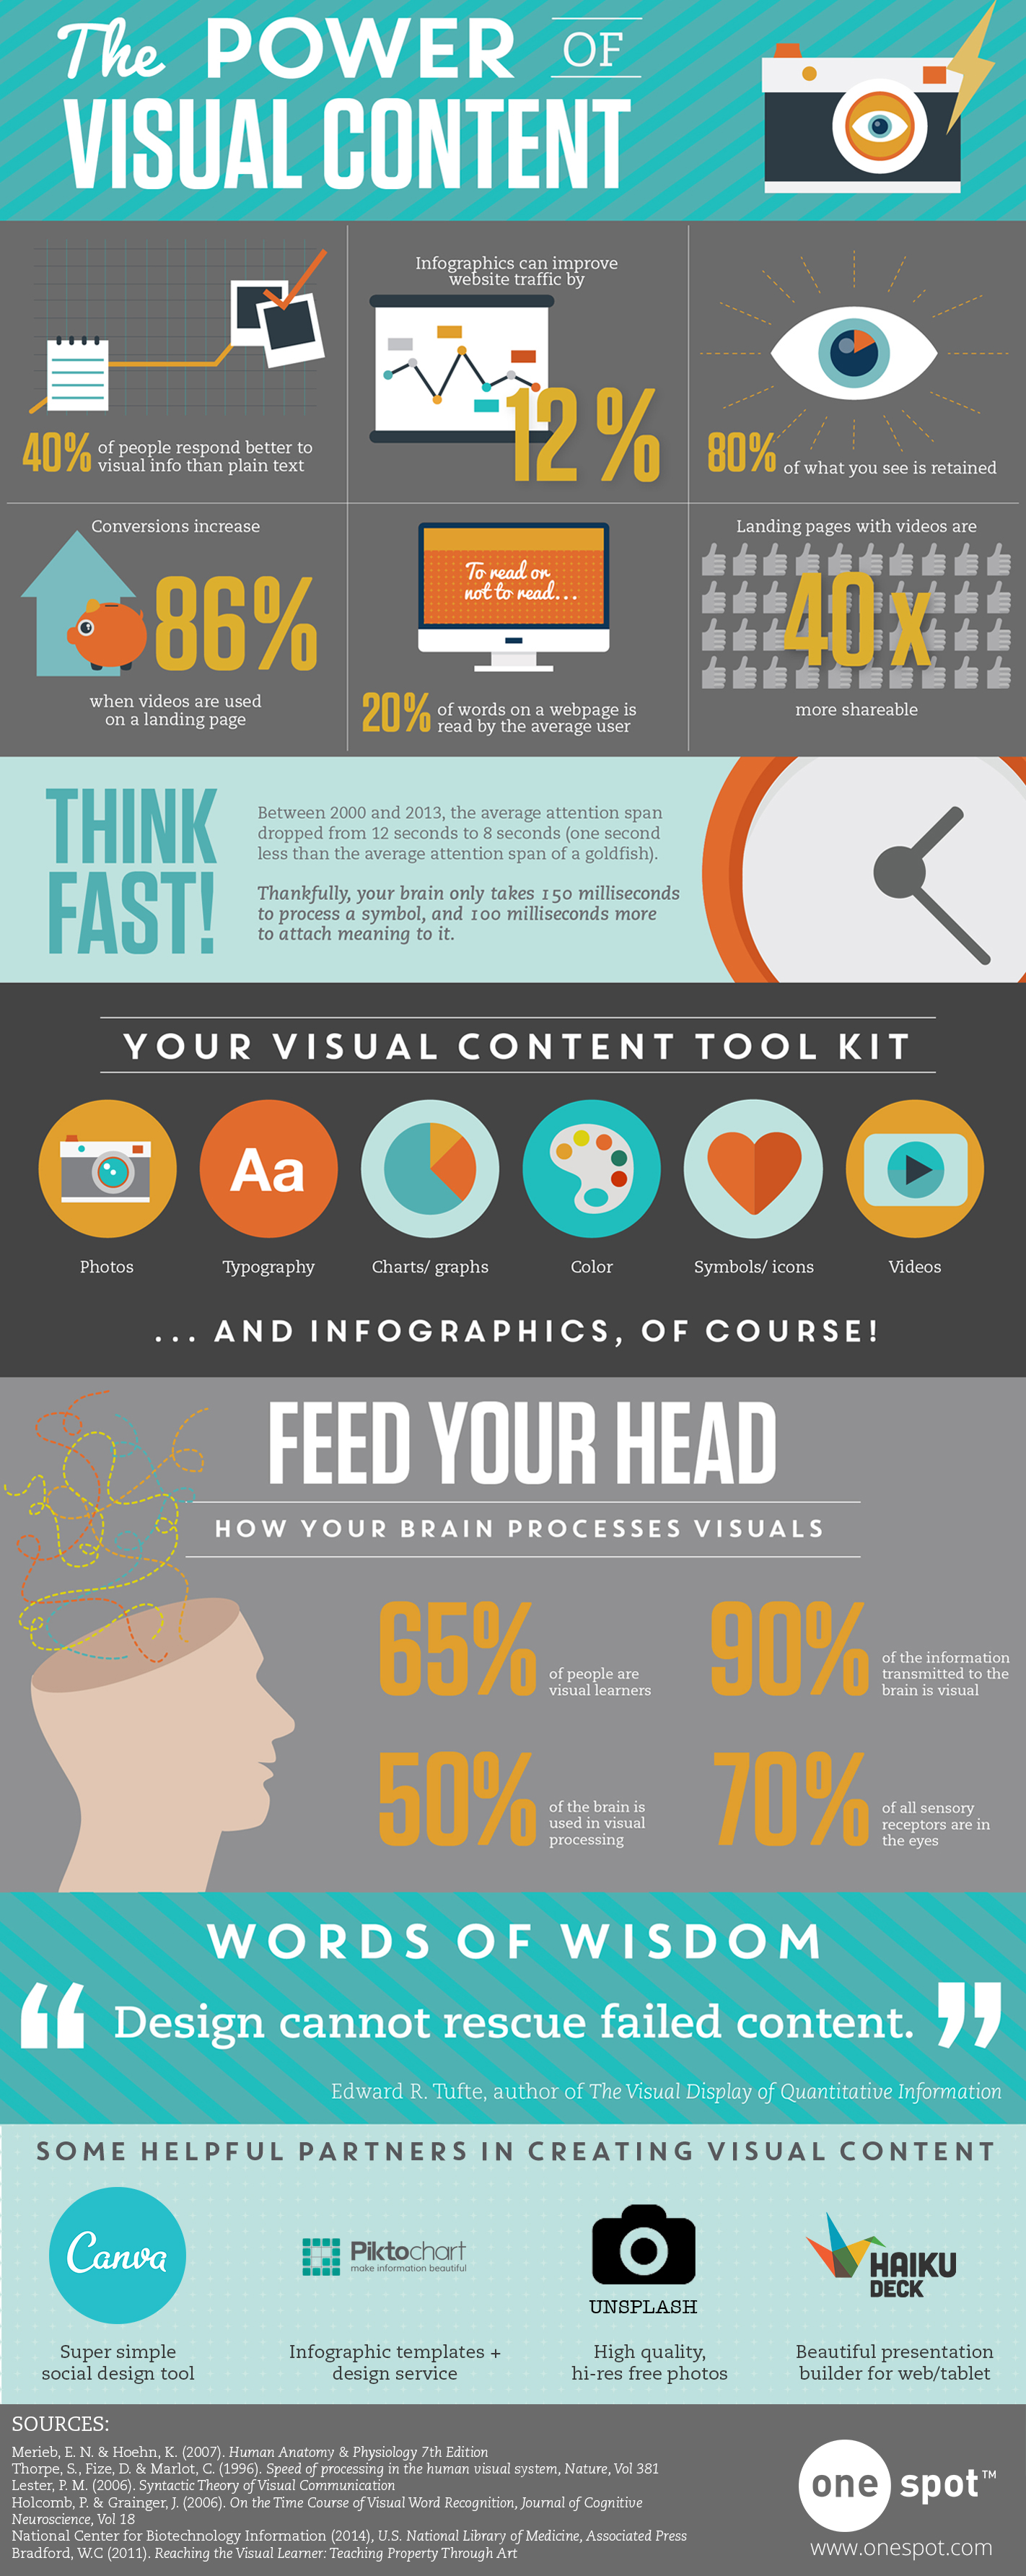
- Infographics can help your audience retain information faster. 90% of information transmitted to the brain is visual, and visuals are processed 60,000X faster in the brain than text.”
- Creating graphics in line with your branding and adding your logo to your infographics can improve brand awareness. Using a signature colour can cause an 80% increase in a consumer’s recognition of your brand.
- Research shows that using infographics in your digital marketing efforts can contribute to an increase in website traffic by up to 12%.
- 46 per cent of consumers say that they would pay more to purchase from brands they can trust Using correct, helpful information will show your audience that you are trustworthy and they’ll see you as an expert in your field.
- Infographics are liked and shared more than any other type of content on social media, meaning you are more likely to reach a much wider audience.
- 65% of brands are already using infographics for marketing purposes.
How Infographics Influence Consumer Behaviour in 9 Stats

- On average, people will remember 65% of the information they see in a visual. Whereas they will only remember 10% of the information that they hear out loud.
- 65% of buyers are visual learners. If you want your potential customers to gain more information about your services or product, an infographic is a great way to do this.
- The usage of infographics enhances the drive to read by 80% so if you have a great piece of content that will be valuable to your audience, make sure you incorporate infographics.
- Research has found that web articles and blogs that contain images such as infographics receive 94% more views than those that don’t.
- 81% of people skim the text they read online.- using infographics to display your crucial information will spike user engagement with your business.
- “Infographic” has around 301,000 monthly searches on Google. Users are actively looking for more information which is a great opportunity for you to undertake some keyword research to see what your audience is searching for.
- Customers are 30% more likely to send payment when prompted by colourful visuals.
- The time to find critical info in documents decreases by 39% with the help of visuals.
- Infographics and other colourful visuals can increase sales by up to 80%
Infographics on Social Media

- Tweets that include visuals such as infographics are 150% more likely to be retweeted.
- 65% of B2B marketers have used infographics in their marketing efforts.
- 84% of companies that have used infographics on social media consider them ‘medium effective’
- Infographics are a great tool for driving interested traffic to your website from social media – 36.4% of people click on the first link in an infographic.
- Infographics are shared on social media three times more than any other type of content.
- Content with relevant images gets 94% more views than content without relevant images
- On LinkedIn, images generally result in a 98% higher comment rate. A branded infographic can make your post and your content stand out against your competitors.
- 41.1% of marketers said original graphics such as infographics performed best for them compared to other assets, such as stock imagery, on social.
7 Infographic Usage Statistics

- 60% of businesses have used infographics in their content strategy.
- 55% of marketers create social media infographics more than any other visual media.
- 86% of businesses predict that visuals will be an important part of their strategy
- 62% of content marketers publish visuals such as infographics at least 2 times a week.
- Researchers demonstrated 80% higher readership rates when content used visuals like charts, graphs, colour design and images.
- On a scale from 1-10 measuring difficulty, 44% of marketers ranked creating infographics a 7 or higher.
- Infographics are the fourth most-used type of content marketing.
Introducing Infographics into Your Marketing Strategy
If you’ve not yet been convinced that infographics can be a great addition to your digital marketing strategy, their range of uses may push you over the line. Infographics can be used for so much more than simply highlighting stats. Businesses can use them on their Social channels to educate their audience on their products and services and use them in blogs to highlight key takeaways in an easy-to-digest format. They can even be used to add visual elements to email marketing.
They allow audiences to easily see key information in an eye-catching format, which is also great for brand awareness. By making life easier for your audience, you are also creating a better customer experience for your audience, making them more likely to convert.
There are few places in digital marketing where you won’t see an infographic of some form. For more information on how you can educate your audience and grow brand awareness through digital marketing, don’t hesitate to reach out to our team.


